Editor’s note: Tom Tunguz is a principal at Redpoint Ventures, and previously a Google product manager, who worked on social media monetization.
Tom blogs at tomasztunguz.com and you can follow him on Twitter at @ttunguz.
Over the next five weeks, I invite you to journey through an analysis of the public and private technology markets. Each weekend of the subsequent month we will uncover trends in the private technology markets and ultimately seek predictive factors to inform fund raising decisions. We begin by placing the broad technology market in a historical context.
Chart 1: It’s been a wild ride
Over the past 30 years, technology companies have boomed, busted and boomed again. In 1980, the global market cap of technology companies totaled $50B, 1.7% of all global equities. Ten years later, tech market caps tripled to $176B. Then, technology companies entered hyper-growth, registering 140% annual growth rates for ten years surpassing $8T in global market cap in 2000. At its zenith, IT companies represented one-fourth of all equity value in the world – pure euphoria. At its post-2000 nadir three short years later, technology market caps deflated 63% to $3T. Today, the sector has settled: technology equity is worth $7T and represents 14.7% of the total global market cap. [1]

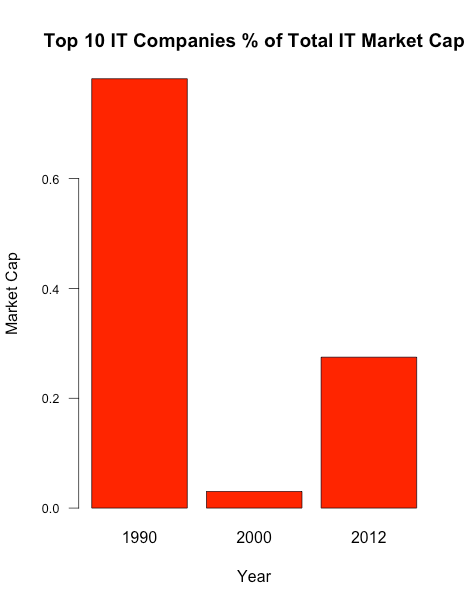
Chart 2: The technology market has fragmented
In 1990, technology oligarchs controlled the industry. The largest 10 IT companies represented over 80% of the value of the entire IT sector. In 2000, at the height of the boom, that figure dropped to 5% due to the overzealous IPO glut. In 2012 the top 10 companies’ share rebounded to 30% of total IT market cap, marking a healthy and competitive industry. [2]

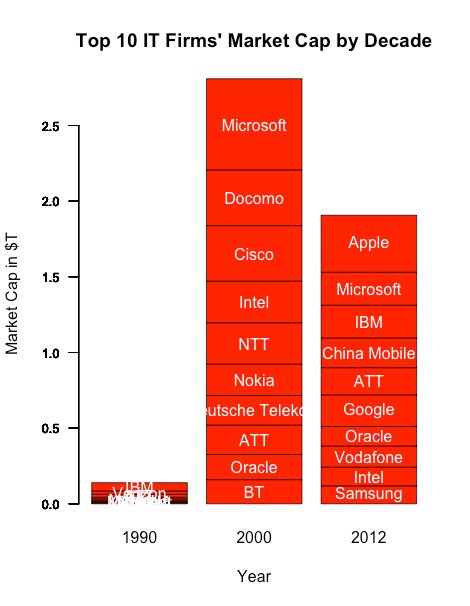
Chart 3: The largest IT market cap in 2000 exceeded Apple’s market cap today
At its peak Microsoft’s market cap eclipsed $640B in 2000, 14% larger than Apple’s current value $565B. Simultaneously, Docomo and Cisco each amassed market capitalizations of $360B, which equalled Apple’s market cap in January 2012 and bested the second largest tech company, Microsoft, by 65%. Today’s tech industry has its share of titans, but at an average 17 price-to-earnings (P/E) ratio, these giant’s valuations fall within the current market norms and are a distant cry from the 70 P/E characterizing the bubble. [2] [3] [5]

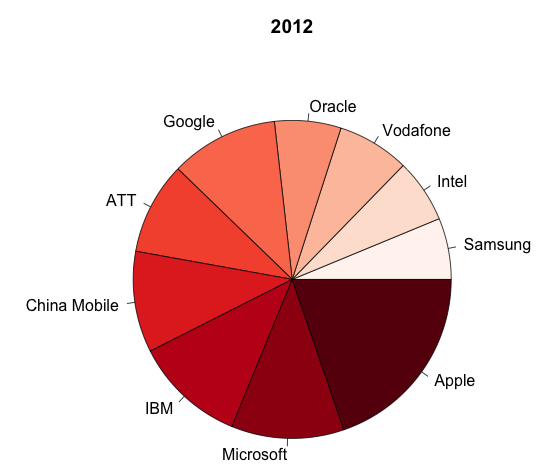
Chart 4: The constitution of the technology industry changes every 10 years
In 1990, telcos and computer makers dominated the ten largest companies. IBM represented more than 35% of the sum of the top 10 market caps and the top 4 companies exceed 75% share. Software maker Microsoft appeared in the top 10 for the first time. NB: Verizon was then known as GTE, the entity at the time.

In 2000, software dethroned hardware as market leaders. Growth in IT spending fueled this boom as enterprises clamored to install new technology stacks. Microsoft surpassed IBM, who fell off the top 10 list. Oracle trailed closely, growing with the demand for enterprise databases. Networking and telecom remained at the table as PC sales boomed as telcos deployed the networking infrastructure to interconnect millions of terminals.

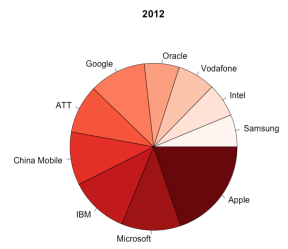
In 2012, mobile became the zeitgeist. Samsung and Apple rocketed to the fore. Mobile carriers form the largest bloc comprising ATT, Verizon, China Mobile and Vodafone. A reinvigorated, software-services-focused IBM joined Microsoft and Oracle representing enterprise software. Google cracked into the rankings as the sole entrant embodying pure Internet. [2]

Through it all, Microsoft and Intel are the only companies present the top 10 market caps each decade, a testament to technology’s relentless pursuit of invention and innovation.
Vertical Capital Updraft
The technology sector has never been better diversified, providing a huge vertical updraft of acquisition capital. The top 10 IT companies’ cash current positions of $250B are 18 times greater than the total value of annual venture backed M&A transactions (approximately $17B annually), presenting a lush environment for startups to thrive. [2, 4]Sources:
[1] CapitalIQ research for technology sector data. IMF and US Census for global market cap figures, 2010.
[2] CapitalIQ research, 2012.
[3] Yahoo Finance, 2012.
[4] National Venture Capital Association, 2011.
[5] Federal Reserve Bank of San Francisco analysis of S&P technology stocks, 2001.
Source: Techcrunch
Aucun commentaire:
Enregistrer un commentaire